I Tried Data Lake, Data Mesh, and Data Fabric. Here’s My Real Take.

I’m Kayla. I’ve built data stuff for real teams—retail, fintech, and health. I’ve lived the late nights, the “why is this slow?” calls, and the wins that make you grin on the way home. So here’s my plain take on data lake vs data mesh vs data fabric, with real things I tried, what worked, and what bugged me.

First, what are these things?

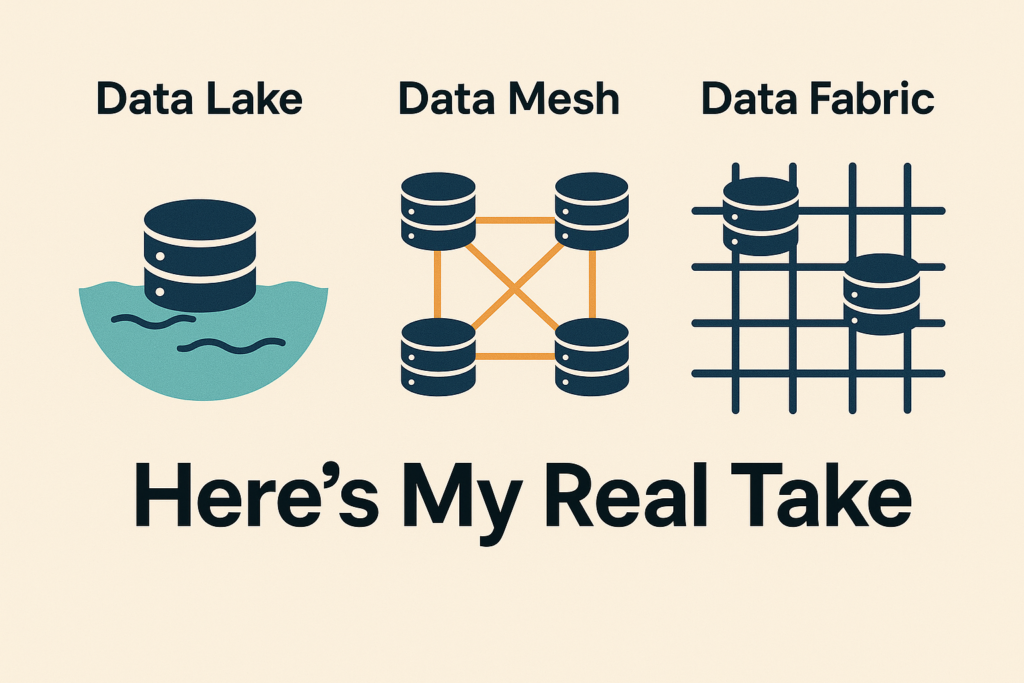
  • Data lake: One big place to store raw data. Think a huge, messy closet on Amazon S3 or Azure. You toss stuff in. You pull stuff out.
  • Data mesh: Each team owns its own data as a “product.” Like mini shops on one street. Shared rules, but each shop runs day to day.
  • Data fabric: A smart layer over all your data. It connects many systems. It lets you find and use data without moving it much.

For a deeper, side-by-side breakdown of how these architectures stack up (lakehouse nuances included), IBM has put together a solid analysis in IBM's comparison of Data Lakehouse, Data Fabric, and Data Mesh.

Want an even snappier cheat-sheet? I sometimes point teammates to BaseNow, whose no-nonsense glossary nails these terms in two minutes.

You know what? They all sound nice on slides. But they feel very different in real work.

By the way, if you’d like the unfiltered, behind-the-scenes version of my journey with all three paradigms, I’ve written up a hands-on review that you can find right here.


My data lake story: Retail, late nights, big wins

Stack I used: AWS S3, Glue, Athena, Databricks, and a bit of Kafka for streams. We cataloged with AWS Glue and later added Amundsen so folks could search stuff.

What I loved:

  • Cheap storage. We kept click logs, orders, images, all of it.
  • Fast setup. We had a working lake in two weeks.
  • Our data science team lived in it. Databricks + Delta tables felt smooth.

One win I still remember:

  • Black Friday, 2 a.m. Marketing wanted “Which email drove the most carts in the last 6 hours?” I ran a quick Athena query on S3 logs. Ten minutes later, they had the answer. They changed the hero banner by 3 a.m. Sales bumped by noon. Felt good.

What hurt:

  • The “swamp” creep. Too many raw folders. Names got weird. People saved copies. Then more copies.
  • Slow “who owns this?” moments. We had five versions of “orders_clean.” Which one was true? Depends. That’s not great.
  • Governance got heavy. We added tags and rules late. Cleaning after the mess is harder than setting rules from day one.

When I’d pick a data lake again:

  • You need to store a lot, fast.
  • Your team is small but scrappy.
  • You want a playground for ML, logs, and raw feeds.

My data mesh story: Fintech with sharp edges

Stack I used: Snowflake for storage and compute. Kafka for events. dbt for transforms. Great Expectations for tests. DataHub for catalog and lineage. Each domain had a git repo and CI rules.

How it felt:

  • We had domains: Payments, Risk, Customer, and Ledger. Each team owned its pipelines and “data products.”
  • We set clear SLAs. If Risk needed fresh events by 9 a.m., Payments owned that.

What I loved:

  • Speed inside teams. The Risk team fixed a fraud feature in five days. They didn’t wait on a central team. That was huge.
  • Clear contracts. Schemas were versioned. Breaking changes had to pass checks. You break it, you fix it.
  • Better naming. When you own the thing, you care more.

What stung:

  • It’s an org change, not just tech. Some teams were ready. Some were not. Coaching took time.
  • Costs can creep. Many teams, many jobs, many warehouses. You need guardrails.
  • Dupes happen. We had two “customer_id” styles. One salted, one not. Took a month to settle a shared rule.

One real moment:

  • A partner changed a “transaction_type” enum. They told one team, not all. Our tests caught it in CI. Nothing blew up in prod. Still, it took a day of Slack pings to agree on names. Those Slack pings also reminded me how much of our collaboration (and sanity-saving venting) happens in chat rooms; if you ever need an off-the-clock space to unwind and connect with friendly folks, GayChat offers real-time conversations with an inclusive community where you can recharge before diving back into data.

On other nights when the dashboards are green early and you’re around Chicagoland looking for an even quicker offline reset, browsing One Night Affair’s Backpage Skokie listings can surface last-minute meet-ups, local events, and personal ads—turning a caffeine-fueled deploy into a spontaneous social story worth telling on Monday.

When I’d pick data mesh:

  • You have several strong domain teams.
  • Leaders back shared rules, not just talk.
  • You want fast local control, with checks.

My data fabric story: Health care, lots of rules

Stack I used: IBM Cloud Pak for Data with governance add-ons, Denodo for virtual views, Collibra for catalog, Azure AD for access. Many sources: Epic (EHR), SAP, and a pile of vendor APIs.

How it felt:

  • We didn’t copy data as much. We connected to sources and used views.
  • Policy-based access worked well. A nurse saw one thing. A data scientist saw another. Same “dataset,” different masks.

What I loved:

  • It helped with audits. HIPAA checks went smoother. We had lineage: who touched what, and when.
  • Less data movement. Fewer nightly “copy all the things” jobs.
  • One search box. Folks found what they needed faster.

What bugged me:

  • Performance. Heavy joins across three systems got slow. We used caching and pushdown tricks, but not perfect.
  • Setup time. Lots of config, lots of roles, lots of meetings.
  • Licenses add up. Budget had to agree.

A real moment:

  • A care quality report crossed Epic and a claims mart. First run was 14 minutes. We added caching on Denodo and tuned filters. It dropped to under 3 minutes. Not magic, but good enough for daily use. The compliance team smiled. That’s rare.

When I’d pick data fabric:

  • You have strict data rules and many sources.
  • You want one control layer.
  • You can live with some tuning for speed.

So… which one should you pick?

Quick gut check from my hands-on time: Airbyte’s exploration of Data Mesh vs. Data Fabric vs. Data Lake walks through the pros and cons in even more detail.

  • Go lake when you need a big, cheap store and fast build. Great for logs, ML, and ad hoc.
  • Go mesh when your company has real domain teams and clear owners. You value speed in each team, and you can set shared rules.
  • Go fabric when you have many systems, strict access needs, and you want a single control layer without moving every byte.

If you’re small? Start lake. If you’re midsize with strong teams? Mesh can shine. If you’re big and regulated? Fabric helps a lot.


Costs, skills, and time-to-smile

  • Cost shape:
    • Lake: storage cheap; people time grows if messy.
    • Mesh: team time higher; surprise compute bills if you don’t watch.
    • Fabric: licenses and setup are not cheap; steady after it lands.
  • Skills:
    • Lake: cloud basics, SQL, some data engineering.
    • Mesh: same plus domain leads, CI, contracts, testing culture.
    • Fabric: virtualization, catalogs, policy design, query tuning.
  • Time:
    • Lake: days to weeks.
    • Mesh: months; it’s culture, not just code.
    • Fabric: months; needs careful rollout.

Pitfalls I’d warn my past self about

  • Name stuff early. It saves pain later. Even a simple guide helps.
  • Track data contracts. Use tests. Break builds on breaking changes. People will thank you.
  • Watch spend. Small jobs add up. Tag everything.
  • Add a data catalog sooner than you think. Even basic. Even free.
  • Write SLAs you can keep. Freshness, accuracy, run windows. Don’t guess—measure.

My quick grades (from my own use)

  • Data lake: 8/10 for speed and cost. 6/10 for control. Call it a strong starter.
  • Data mesh: 9/10 for team speed when culture fits. 6/10 if your org isn’t ready.
  • Data fabric: 8/10 for governance and findability. 7/10 on raw speed without tuning.

I know, scores are fuzzy. But they match how it felt in the real trenches.


Final word

None of these is pure good or pure bad. They’re tools. I’ve mixed them too: a lake as the base, mesh for team ownership

I ran our hospital’s data warehouse on Snowflake. Here’s how it really went.

I’m Kayla. I lead data work at a mid-size health system. I moved our old warehouse from a slow on-prem server to Snowflake. I used it every day for 18 months. I built the models. I fixed the jobs when they broke at 3 a.m. I also drank a lot of coffee. You know what? It was worth it—mostly.

What we built (in plain talk)

We needed one place for truth. One spot where Epic data, lab feeds, claims, and even staffing data could live and play nice.

  • Core: Snowflake (our warehouse in the cloud)
  • Sources: Epic Clarity and Caboodle (SQL Server), Cerner lab, 837/835 claims, Kronos, Workday
  • Pipes and models: Matillion for loads, dbt for models, a few Python jobs, Mirth Connect for HL7
  • Reports: Tableau and a little Power BI

If you’re starting from scratch and want to see what a HIPAA-ready architecture looks like, Snowflake’s own HIPAA Data Warehouse Built for the Cloud guide walks through the essentials.

We set up daily loads at 4 a.m. We ran near real-time feeds for ED arrivals and sepsis alerts. We used a patient match tool (Verato) to link records. Simple idea, hard work.

The first week felt fast—and a bit wild

Snowflake was quick to start. I spun up a “warehouse” (their word for compute) in minutes. We cloned dev from prod with no extra space. That was cool. Time Travel saved me on day 6 when a junior analyst ran a bad delete. We rolled back in minutes. No drama.

But I hit a wall on roles and rights. PHI needs care. I spent two long nights sorting who could see what. We set row rules by service line. We masked birth dates to month and year. It took trial and error, and a few “whoops, that query failed” moments, but it held.

Real wins you can feel on the floor

  • Sepsis: Our ICU sepsis dashboard refreshed every 15 minutes. We cut time to first antibiotic by 14 minutes on average. That sounds small. It isn’t. It saved stays.
  • Readmits: For heart failure, 30-day readmits dropped by 3.2 points in six months. We found “frequent flyer” patterns, called them early, and set follow-ups before discharge.
  • ED flow: We tracked “door to doc” and “left without being seen” in near real time. Weekend waits dropped by about 12 minutes. That felt human.
  • Supply chain: During flu season, PPE burn rate showed we were over-ordering. We canceled two rush orders and saved about $220k. My buyer hugged me in the hall. Awkward, but sweet.
  • Revenue: We flagged claims with likely denials (we saw bad combos in the codes). Fixes at the front desk helped. We cut avoidable write-offs by about $380k in a quarter.

What Snowflake did best for us

  • Speed on big joins: Our “all visits for the last 2 years” query went from 28 minutes on the old box to 3 minutes on a Medium warehouse.
  • Easy scale: Month-end? Bump to Large, finish fast, and drop back. Auto-suspend keeps costs in check.
  • Zero-copy clones: Perfect for testing break-fix without fear.
  • Data sharing: We gave a payer a clean view with masked fields. No file toss. No FTP pain.
  • Time Travel: Saved me twice from bad deletes. Fridays, of course.

What hurt (and how we patched it)

  • FHIR is not “push button”: We had to build our own views and map HL7 FHIR. Mirth helped, but we still wrote a lot of code.
  • Epic upgrades break stuff: When Epic changed a column name, our nightly job cried. We added dbt tests, schema checks, and a “red light” channel. Still, a few 3 a.m. pings.
  • Identity match is messy: Twins, hyphenated names, address changes. Our duplicate rate was 1.8%. After tuning the match tool and rules, we got it near 0.4%. Close enough to trust, not perfect.
  • Costs can spike: One Tableau workbook ran a cross-join and woke a Large warehouse. Ouch. We set resource monitors and query limits. We also taught folks to use extracts.
  • SCD history needs care: We built Type 2 in dbt with macros. It works. But Snowflake doesn’t hand that to you out of the box.

Costs in plain words

We’re mid-size. Storage was cheap. Compute was the big line.

  • Normal month: about $38k total (compute + storage).
  • Month-end with big crunch: up to $52k.
  • We set auto-suspend to 60 sec and used Small/Medium most days. That cut spend by ~22%.
  • Cross-region shares add fees. Keep data close to users when you can.

Is it worth it? For us, yes. The readmit work alone paid for it.

If you’d like the detailed cost-control checklist I use (scripts, monitors, and all), I’ve posted it on BaseNow so you can borrow what you need. I also pulled together a step-by-step recap of the entire migration—what went right, what broke, and the coffee count. You can find that case study if you want the full story.

Security and HIPAA stuff (yes, I care)

  • We signed the BAA. Data was encrypted at rest and in flight.
  • Row rules and masking kept PHI safe. We hid names for wide reports and showed only what each team needed.
  • Audits were fine. We logged who saw what. Our infosec lead slept better. Honestly, so did I.
  • Snowflake’s recent HITRUST r2 certification also checked a big box for our auditors.

Modern healthcare data teams obsess over encryption and consent, and those same privacy principles matter in everyday digital life, too. If you’re looking for a real-world example outside the clinical setting—say, how to keep personal messages both respectful and secure—the practical lesbian sexting guide offers step-by-step safety tips, consent checklists, and creative conversation starters you can use right away. Similarly, if you're browsing local classified ads for casual connections around Vista, the well-maintained Backpage Vista alternative offers fresh listings, filtering tools, and practical advice on staying discreet and safe while arranging meet-ups.

Daily life with the stack

Most days were smooth. Jobs kicked off at 4 a.m. I checked the health page, sipped coffee, and fixed the one thing that squeaked. On cutover weekend, we camped near the command center with pizza. Not cute, but it worked.

When flu picked up, we bumped compute from Small to Medium for the morning rush, then back down by lunch. That rhythm kept people happy and bills sane.

Who should pick this

  • Good fit: Hospitals with 200+ beds, ACOs, health plans, labs with many feeds, groups with Epic or Cerner and a real need for near real-time views.
  • Might be heavy: A single clinic with one EMR and a few static reports. You may not need this muscle yet.

Still on the fence about warehouse versus lake—or even a full-on mesh? I put each approach through its paces and wrote up the real pros and cons in this deep dive.

What I’d change

  • A simple, native FHIR toolkit. Less glue. Fewer scripts.
  • Easier role setup with PHI presets. A “starter pack” for healthcare would help.
  • Cheaper cross-region shares. Or at least clearer costs up front.

Little moments that stuck with me

  • A Friday night delete fixed by Time Travel in five minutes. I still smile about that save.
  • A charge nurse told me the sepsis page “felt like a head start.” That line stays with me.
  • A CFO who hated “data chat” stopped by and said, “That denial chart? Keep that one.” I printed it. Kidding. Kind of.

My verdict

Snowflake as our healthcare warehouse scored an 8.5/10 for me. It’s fast, flexible, and strong on sharing. You must watch costs, plan for schema churn, and build your own FHIR layer. If you’re ready for that, it delivers.

Would I use it again for a hospital? Yes. With guardrails on cost, clear tests on loads, and a friendly channel for “Hey, this broke,” it sings. And when flu season hits, you’ll be glad it can stretch.

I Tried Different Data Warehouse Models. Here’s My Take.

Note: This is a fictional first-person review written for learning.

I spend a lot of time with warehouses. Not the kind with forklifts. The data kind. I build models, fix weird joins, and help teams get reports that don’t lie. Some models felt smooth. Some made me want to take a long walk.
If you’d like a deeper, step-by-step breakdown of the experiments I ran, check out this expanded write-up on trying different data-warehouse models.

Here’s what stood out for me, model by model, with real-life style examples and plain talk. I’ll keep it simple. But I won’t sugarcoat it.


The Star That Actually Shines (Kimball)

This one is the crowd favorite. You’ve got a fact table in the middle (numbers), and dimension tables around it (things, like product or store). It’s easy to see and easy to query.

For a crisp refresher on how star schemas power OLAP cubes, the Kimball Group’s short guide on the pattern is worth a skim: Star Schema & OLAP Cube Basics.

  • Where I used it: a retail group with Snowflake, dbt, and Tableau.
  • Simple setup: a Sales fact with date_key, product_key, store_key. Then Product, Store, and Date as dimensions.
  • We added SCD Type 2 on Product. That means we kept history when a product changed names or size.

What I liked:

  • Dashboards felt fast. Most ran in 2–5 seconds.
  • Analysts could write SQL with less help. Fewer joins. Fewer tears.
  • Conformed dimensions made cross-team work sane. One Product table. One Customer table. Life gets better.

What bugged me:

  • When the source changed a lot, we rebuilt more than I wanted.
  • Many-to-many links (like customer to household) needed bridge tables. They worked, but it felt clunky.
  • Wide facts got heavy. We had to be strict on grain (one row per sale, no sneaky extras).

Little trick that helped:

  • In BigQuery, we clustered by date and customer_id. Scan size dropped a ton. Bills went down. Smiles went up.

Snowflake Schema (Not the Company, the Shape)

This is like star, but dimensions are split out into smaller lookup tables. Product splits into Product, Brand, Category, etc.

  • Where I used it: marketing analytics on BigQuery and Looker.

What I liked:

  • Better data hygiene. Less copy-paste of attributes.
  • Great for governance folks. They slept well.

What bugged me:

  • More joins. More cost. More chances to mess up filters.
  • Analysts hated the hop-hop-hop between tables.

Would I use it again?

  • Only when reuse and control beat speed and ease. Else, I stick with a clean star.

Inmon 3NF Warehouse (The Library)

This model is neat and very normalized. It feels like a library with perfect shelves. It’s great for master data and long-term truth.

  • Where I used it: a healthcare group on SQL Server and SSIS, with Power BI on top.

What I liked:

  • Stable core. Doctors, patients, visits—very clear. Auditors were happy.
  • Changes in source systems didn’t break the world.

What bugged me:

  • Reports were slow to build right on top. We still made star marts for speed.
  • More tables. More joins. More time.

My note:

  • If you need a clean “system of record,” this is strong. But plan a mart layer for BI.

If you’re curious how a heavily regulated environment like healthcare handles modern cloud warehouses, my colleague’s narrative about moving a hospital’s data warehouse to Snowflake is worth a read: here’s how it really went.


Data Vault 2.0 (The History Buff)

Hubs, Links, and Satellites. It sounds fancy, but it’s a simple idea: store keys, connect them, and keep all history. It’s great when sources change. It’s also great when you want to show how data changed over time.

For a deeper dive into the principles behind this approach, the IRI knowledge base has a solid explainer on Data Vault 2.0 fundamentals.

  • Where I used it: Azure Synapse, ADF, and dbt. Hubs for Customer and Policy. Links for Customer-Policy. Satellites for history.
  • We then built star marts on top for reports.

What I liked:

  • Fast loads. We added new fields without drama.
  • Auditable. I could show where a value came from and when it changed.

What bugged me:

  • Storage got big. Satellites love to eat.
  • It’s not report-ready. You still build a star on top, so it’s two layers.
  • Training was needed. New folks got lost in hubs and links.

When I pick it:

  • Many sources, lots of change, strict audit needs. Or you want a long-term core you can trust.

Lakehouse with Delta (Raw, Then Clean, Then Gold)

This is lakes and warehouses working together. Files first, tables later. Think Bronze (raw), Silver (clean), Gold (curated). Databricks made this feel smooth for me.

  • Where I used it: event data and ads logs, with Databricks, Delta Lake, and Power BI.
  • Auto Loader pulled events. Delta handled schema drift. We used Z-Ordering on big tables to speed lookups.

What I liked:

  • Semi-structured data was easy. JSON? Bring it.
  • Streaming and batch in one place. One pipeline, many uses.
  • ML teams were happy; BI teams were okay.

What bugged me:

  • You need clear rules. Without them, the lake turns to soup.
  • SQL folks sometimes missed a classic warehouse feel.

When it shines:

  • Clickstream, IoT, logs, fast feeds. Then build tidy gold tables for BI.

Side note:

  • I’ve also used Iceberg on Snowflake and Hudi on EMR. Same vibe. Pick the one your team can support.

One Big Table (The Sledgehammer)

Sometimes you make one huge table with all fields. It can be fast. It can also be a pain.

  • Where I used it: finance month-end in BigQuery. One denormalized table with every metric per month.

What I liked:

  • Dashboards flew. Lookups were simple.
  • Less room for join bugs.

What bugged me:

  • ETL was heavy. Any change touched a lot.
  • Data quality checks were harder to aim.

I use this for narrow, stable use cases. Not for broad analytics.


A Quick Word on Data Mesh

This is not a model. It’s a way to work. Teams own their data products. I’ve seen it help large groups move faster. But it needs shared rules, shared tools, and strong stewardship. Without that, it gets noisy. Then your warehouse cries.
For a fuller comparison of Data Lake, Data Mesh, and Data Fabric in the real world, take a look at my candid breakdown.


What I Reach For First

Short version:

  • Need fast BI with clear facts? Star schema.
  • Need audit and change-proof ingestion? Data Vault core, star on top.
  • Need a clean system of record for many systems? Inmon core, marts for BI.
  • Got heavy logs and semi-structured stuff? Lakehouse with a gold layer.
  • Need a quick report for one team? One big table, with care.

My usual stack:

  • Raw zone: Delta or Iceberg. Keep history.
  • Core: Vault or 3NF, based on needs.
  • Marts: Kimball stars.
  • Tools: dbt for models, Airflow or ADF for jobs, and Snowflake/BigQuery/Databricks. Power BI or Tableau for viz.

Real Moments That Taught Me Stuff

  • SCD Type 2 saved us when a brand reorg hit. Old reports kept old names. New reports showed new names. No fights in standup.
  • We forgot to cluster a BigQuery table by date. A daily report scanned way too much. Bills went up. We fixed clustering, and the scan dropped by more than half.
  • A vault model let us add a new source system in a week. The mart took another week. Still worth it.
  • A lakehouse job choked on bad JSON. Auto Loader with schema hints fixed it. Simple, but it felt like magic.

Pitfalls I Try to Avoid

  • Mixing grains in a fact table. Pick one grain. Tattoo it on the README.
  • Hiding business logic in ten places. Put rules in one layer, and say it out loud.
  • Over-normalizing a star. Don’t turn stars into snowstorms.
  • Skipping data tests. I use dbt tests for keys, nulls, and ranges. Boring, but it saves weekends.

My Bottom Line

There’s no one model to rule them all. I know, I wish. But here’s the thing: the right model matches the job, the team, and the data. Stars make

I test data warehouses. Here’s what actually helped me sleep.

I’m Kayla. I break and fix data for a living. I also test it. If you’ve ever pushed a change and watched a sales dashboard drop to zero at 9:03 a.m., you know that cold sweat. I’ve been there, coffee in hand, Slack blowing up.

Over the last year I used four tools across Snowflake, BigQuery, and Redshift. I ran tests for dbt jobs, Informatica jobs, and a few messy Python scripts. Some tools saved me. Some… made me sigh. Here’s the real talk and real cases. (I unpack even more lessons in this extended write-up if you want the long version.)


Great Expectations + Snowflake: my steady helper

I set up Great Expectations (GE) with Snowflake and dbt in a small shop first, then later at a mid-size team. Setup took me about 40 minutes the first time. After that, new suites were fast.

If you’re curious how Snowflake fares in a high-stakes healthcare environment, there’s a detailed field story in this real-world account.

What I liked:

  • Plain checks felt clear. I wrote “no nulls,” “row count matches,” and “values in set” with simple YAML. My junior devs got it on day two.
  • Data Docs gave us a neat web page. PMs liked it. It read like a receipt: what passed, what failed.
  • It ran fine in CI. We wired it to GitHub Actions. Red X means “don’t ship.” Easy.

Before jumping into the war stories, I sometimes spin up BaseNow to eyeball a few sample rows—the quick visual check keeps me honest before the automated tests run.

Real save:

  • In March, our Snowflake “orders” table lost 2.3% of rows on Tuesdays. Odd, right? GE caught it with a weekday row-count check. Turned out a timezone shift on an upstream CSV dropped late-night rows. We fixed the loader window. No more gaps.
  • Another time, a “state” field got lowercase values. GE’s “values must be uppercase” rule flagged it. Small thing, but our Tableau filter broke. A one-line fix saved a demo.

Things that annoyed me:

  • YAML bloat. A big suite got long and noisy. I spent time cleaning names and tags.
  • On a 400M row table, “expect column values to be unique” ran slow unless I sampled. Fine for a guardrail, not for deep checks.
  • Local dev was smooth, but our team hit path bugs across Mac and Windows. I kept a “how to run” doc pinned.

Would I use it again? Yes. For teams with dbt and Snowflake, it’s a good base. Simple, clear, and cheap to run.


Datafold Data Diff: clean PR checks that saved my bacon

I used Datafold with dbt Cloud on BigQuery and Snowflake. The main magic is “Data Diff.” It compares old vs new tables on a pull request. No guesswork. It told me, “this change shifts revenue by 0.7% in CA and 0.2% in NY.” Comments showed up right on the PR.

Real save:

  • During Black Friday week, a colleague changed a join from left to inner. Datafold flagged a 12.4% drop in “orders_last_30_days” for Marketplace vendors. That would’ve ruined a forecast deck. We fixed it before merge.
  • Another time, I refactored a dbt model and forgot a union line. Datafold showed 4,381 missing rows with clear keys. I merged the fix in 10 minutes.

What I liked:

  • Setup was fast. GitHub app, a warehouse connection, and a dbt upload. About 90 minutes end to end with coffee breaks.
  • The sample vs full diff knob was handy. I used sample for quick stuff, full diff before big releases.
  • Column-level diffs were easy to read. Like a receipt but for data.

The trade-offs:

  • Cost. It’s not cheap. Worth it for teams that ship a lot. Hard to sell for tiny squads.
  • BigQuery quotas got grumpy on full diffs. I had to space jobs. Not fun mid-sprint.
  • You need stable dev data. If your dev seed is small, you can miss weird edge rows.

Would I buy again? Yes, if we have many PRs and a CFO who cares about trust. It paid for itself in one hairy week.


QuerySurge: old-school, but it nails ETL regression

I used QuerySurge in a migration from Teradata and Informatica to Snowflake. We had dozens of legacy mappings and needed to prove “old equals new.” QuerySurge let us match source vs target with row-level compare. It felt like a lab test.

Real cases:

  • We moved a “customers_dim” with SCD2 history. QuerySurge showed that 1.1% of records had wrong end dates after load. Cause? A date cast that chopped time. We fixed the mapping and re-ran. Green.
  • On a finance fact, it found tiny rounding drifts on Decimal(18,4) vs Float. We pinned types and solved it.

What I liked:

  • Source/target hooks worked with Teradata, Oracle, Snowflake, SQL Server. No drama.
  • Reusable tests saved time. I cloned a pattern across 30 tables and tweaked keys.
  • The scheduler ran overnight and sent a tidy email at 6:10 a.m. I kind of lived for those.

What wore me out:

  • The UI feels dated. Clicks on clicks. Search was meh.
  • The agent liked RAM. Our first VM felt underpowered.
  • Licenses. I had to babysit seats across teams. Admin work is not my happy place.

Who should use it? Teams with heavy ETL that need proof, like audits, or big moves from old to new stacks. Not my pick for fresh, ELT-first shops.


Soda Core/Soda Cloud: light checks, fast alerts

When I needed fast, human-friendly alerts in prod, Soda helped. I wrote checks like “row_count > 0 by 7 a.m.” and “null_rate < 0.5%” in a small YAML file. Alerts hit Slack. Clear. Loud.

Real save:

  • On a Monday, a partner API lagged. Soda pinged me at 7:12 a.m. Row count was flat. I paused the dashboards, sent a quick note, and nobody panicked. We re-ran at 8:05. All good.

Nice bits:

  • Devs liked the plain checks. Less code, more signal.
  • Anomalies worked fine for “this looks off” nudges.
  • Slack and Teams alerts were quick to set up.

Rough edges:

  • Late data caused false alarms. We added windows and quiet hours.
  • YAML again. I’m fine with it, but folks still mix spaces. Tabs are cursed.
  • For deep logic, I still wrote SQL. Which is okay, just know the limit.

I keep Soda for runtime guardrails. It’s a pager, not a lab.


My simple test playbook that I run every time

Fast list. It catches most messes.

  • Row counts. Source vs target. Also today vs last Tuesday.
  • Nulls on keys. If a key is null, stop the line.
  • Duplicates on keys. Select key, count(), having count() > 1. Old but gold.
  • Referenced keys. Does each order have a customer? Left join, find orphans.
  • Range checks. Dates in this year, amounts not negative unless refunds.
  • String shape. State is two letters. ZIP can start with 0. Don’t drop leading zeros.
  • Type drift. Decimals stay decimals. No float unless you like pain.
  • Slowly changing stuff. One open record per key, no overlaps.
  • Time zones. Hour by hour counts around DST. That 1–2 a.m. hour bites.

Quick real one:

  • On the fall DST shift, our hourly revenue doubled for “1 a.m.” I added a test that checks hour buckets and uses UTC. No more ghosts.

Speaking of rare edge cases and specialized needs, I’ve noticed that life outside of data engineering benefits from the same “fit-for-purpose” mindset. If your personal interests are as specific as your data quality checks, a resource like this guide to fetish dating can connect you with niche platforms and safety tips, helping you meet like-minded partners while staying informed and comfortable.

Similarly, Detroit-area readers who are looking for discreet, local connection options can explore the curated listings at Backpage Southfield alternatives to browse current meet-up opportunities, read safety recommendations, and compare platform reviews before making plans.


Little gotchas that bit me (and may bite you)

  • CSVs drop leading zeros. I saw “01234” turn into “1234” and break joins.
  • Collation rules changed “Ä” vs “A” in a like filter. Locale matters.
  • Trim your strings. “ CA” is not “CA.” One space cost me a day once.
  • Casts hide sins. TO_NUMBER can turn “
Published
Categorized as Model

“I Tried a Data Warehouse Testing Strategy. Here’s What Actually Worked.”

I’m Kayla, and I run data for a mid-size retail brand. We live in Snowflake. Our pipes pull from Shopify, Google Ads, and a cranky old ERP. This past year, I tried a layered testing plan for our warehouse. Not a fancy pitch. Just a setup that helped me sleep at night. And yes, I used it every day. If you want the unfiltered, step-by-step rundown of the approach, I detailed it in a longer teardown here.

Did it slow us down? A bit. Was it worth it? Oh yeah. For another perspective on building sleep-friendly warehouse tests, you might like this story about what actually helped me sleep.

If you want a vendor-neutral explainer of the core test types most teams start with, the Airbyte crew has a solid primer you can skim here.

What I Actually Used (and Touched, a Lot)

  • Snowflake for the warehouse
  • Fivetran for most sources, plus one cranky S3 job
  • dbt for models and tests
  • Great Expectations for data quality at the edges
  • Monte Carlo for alerts and lineage
  • GitHub Actions for CI checks and data diffs before merges

I didn’t start with all of this. I added pieces as we got burned. Frank truth.

The Simple Map I Followed

I split testing into four stops. Small, clear checks at each step. Nothing clever.

  • Ingest: Is the file or stream shaped right? Are key fields present? Row counts in a normal range?
  • Stage: Do types match? Are dates valid and in range? No goofy null spikes?
  • Transform (dbt): Do keys join? Are unique IDs actually unique? Do totals roll up as they should?
  • Serve: Do dashboards and key tables match what finance expects? Is PII kept where it belongs?

I liked strict guardrails. But I also turned some tests off. Why? Because late data made them scream for no reason. I’ll explain.

Real Fails That Saved My Neck

You know what? Stories beat charts. Here are the ones that stuck.

  1. The “orders_amount” Surprise
    Shopify changed a column name from orders_amount to net_amount without warning. Our ingest check in Great Expectations said, “Field missing.” It failed within five minutes. This would have broken our daily revenue by 18%. We patched the mapping, re-ran, and moved on. No dashboard fire drills. I made coffee.

  2. The Decimal Thing That Messed With Cash
    One week, finance said revenue looked light. We traced it to a transform step that cast money to an integer in one model. A tiny slip. dbt’s “accepted values” test on currency codes passed, but a “sum vs source sum” check failed by 0.9%. That seems small. On Black Friday numbers, that’s a lot. We fixed the cast to numeric(12,2). Then we added a “difference < 0.1%” test on all money rollups. Pain taught the lesson.

  3. Late File, Loud Alarm
    Our S3 load for the ERP was late by two hours on a Monday. Row count tests failed. Slack lit up. People panicked. I changed those tests to use a moving window and “warn” first, then “fail” if still late after 90 minutes. Same safety. Less noise. The team relaxed, and we kept trust in the alerts.

  4. PII Where It Shouldn’t Be
    A junior dev joined email to order facts for a quick promo table. That put PII in a wide fact table used by many folks. Great Expectations flagged “no sensitive fields” in that schema. We moved emails back to the dimension, set row-level masks, and added a catalog rule to stop it next time. That check felt boring—until it wasn’t.

  5. SCD2, Or How I Met a Double Customer
    Our customer dimension uses slowly changing history. A dbt uniqueness test caught two active rows for one customer_id. The cause? A timezone bug on the valid_to column. We fixed the timezone cast and added a rule: “Only one current row per id.” After that, no more weird churn spikes.

  6. Ad Spend That Jumped Like a Cat
    Google Ads spend spiked 400% in one day. Did we freak out? A little. Our change detection test uses a rolling 14-day median. It flagged the spike but labeled it “possible true change” since daily creative spend was planned that week. We checked with the ads team. It was real. I love when an alert says, “This is odd, but maybe fine.” That tone matters.

How I Glue It Together

Here’s the flow that kept us sane:

  • Every PR runs dbt tests in GitHub Actions. It also runs a small data diff on sample rows.
  • Ingest checks run in Airflow right after a pull. If they fail, we stop the load.
  • Transform checks run after each model build.
  • Monte Carlo watches freshness and volume. It pages only if both look bad for a set time.

I tag core models with must-pass tests. Nice-to-have tests can fail without blocking. That mix felt human. We still ship changes, but not blind.

The Good Stuff

  • Fast feedback. Most issues show up within 10 minutes of a load.
  • Plain tests. Unique, not null, foreign keys, sums, and freshness. Simple wins.
  • Fewer “why is this chart weird?” pings. You know those pings.
  • Safer merges. Data diffs in CI caught a join that doubled our rows before we merged.
  • Better trust with finance. We wrote two “contract” tests with them: monthly revenue and tax. Those never break now.

By the way, I thought this would slow our work a lot. It didn’t. After setup, we saved time. I spent less time chasing ghosts and more time on new models.

The Bad Stuff (Let’s Be Grown-Ups)

  • False alarms. Late data and day-of-week patterns fooled us at first. Thresholds needed tuning.
  • Cost. Running tests on big tables is not free in Snowflake. We had to sample smart.
  • Test drift. Models change, tests lag. I set a monthly “test review” now.
  • Secrets live in many places. Masking rules need care, or someone will copy PII by mistake.
  • Flaky joins. Surrogate keys helped, but one missed key map created bad dedupe. Our test caught it, but only after a noisy week.

Two Checks I Didn’t Expect to Love

  • Volume vs. Value. Row counts can look fine while money is way off. We compare both.
  • Freshness with slack. A soft window then a hard cutoff. Human-friendly. Still tough.

What I’d Change Next Time

  • Add a small “business SLO” sheet. For each core metric, define how late is late and how wrong is wrong. Post it.
  • Use seeds for tiny truth tables. Like tax rates and time zones. Tests pass faster with that.
  • Make staging models thin. Most bugs hide in joins. Keep them clear and test them there.
  • Write plain notes in the models. One-line reason for each test. People read reasons.
  • Still deciding between dimensional and vault styles? I compared a few options in this breakdown.

For a complementary angle on laying out an end-to-end warehouse testing blueprint, Exasol’s concise guide is worth a skim here.

I also want lighter alerts. Less red. More context. A link to the failing rows helps more than a loud emoji.

Who This Fits

  • Teams of 1–5 data folks on Snowflake and dbt will like this most.
  • It works fine with BigQuery too.
  • If your work is ad hoc and you don’t have pipelines, this will feel heavy. Start with just freshness and null checks.

Taking a step back, I know marathon debugging sessions can wreck any semblance of a social life. If you ever decide to balance late-night data fixes with a bit of after-hours fun, you can peek at FuckBuddies—the app matches consenting adults for straightforward, no-strings encounters so you can recharge and head back to your pipelines with a clear head.

Likewise, if you’re ever on a sprint in the Research Triangle area and want a similarly low-friction way to unwind, the local classifieds at Backpage Chapel Hill can quickly connect you with nearby, like-minded adults and spare you the time sink of swiping through mainstream apps.

Tiny Playbook You Can Steal

  • Pick 10 tables that matter. Add unique, not null, and foreign key tests.
  • Add a daily revenue and a daily spend check. Compare to source totals.
  • Set freshness windows by source. ERP gets 2 hours. Ads get 30 minutes.
  • Turn on data diffs in CI for your top models.
  • Review noisy tests monthly. Change warn vs fail. Keep it humane.

Final Take

I won’t pretend this setup is magic. It’s not. But

Published
Categorized as Model

I built a data lake for big data. Here’s my honest take.

If you’re curious about how a totally different vertical—think location-based classifieds—can create streams of chaotic, semi-structured postings that put all those flexible-schema claims to the test, take a quick look at Backpage Novato. Exploring the constantly changing ads and free-form text there will give you a concrete feel for the messy, user-generated payloads a well-tuned data lake needs to parse, store, and secure.

Published
Categorized as Model

ODS vs Data Warehouse: How I’ve Used Both, and When Each One Shines

I’ve run both an ODS and a data warehouse in real teams. Late nights, loud Slack pings, cold coffee—the whole bit. I’ve seen them help. I’ve seen them hurt. And yes, I’ve also watched a CFO frown at numbers that changed twice in one hour. That was fun.

Here’s what worked for me, with real examples, plain words, and a few honest bumps along the way.

First, what are these things?

An ODS (Operational Data Store) is like a kitchen counter. It’s where work happens fast. Fresh data lands there from live systems. It’s near real time. It changes a lot. It shows “right now.” If you’d like the textbook definition, here’s an Operational Data Store (ODS) explained in more formal terms.

A data warehouse is like the pantry and the recipe book. It holds history. It keeps clean, stable facts. It’s built for reporting, trends, and “what happened last month” questions. The classic data warehouse definition highlights its role as a central repository tuned for analytics.
For an even deeper dive into how an ODS stacks up against a data warehouse, you can skim my hands-on comparison.

Both matter. But they don’t do the same job.

My retail story: why the ODS saved our Black Friday

I worked with a mid-size retail brand. We ran an ODS on Postgres. We streamed order and shipment events from Kafka using Debezium. Lag was about 2 to 5 seconds. That felt fast enough to breathe.

Customer support used it all day. Here’s how:

  • A customer called: “Where’s my package?” The agent typed the order number, and boom—latest scan from the carrier was there.
  • An address looked wrong? We fixed it before pick and pack. Warehouse folks loved that.
  • Fraud checks ran on fresh payment flags, not stale ones.

Then Friday hit. Black Friday. Orders exploded. The ODS held steady. Short, simple tables. Indexes tuned. We even cached some hot queries in Redis for 60 seconds to keep the app happy. The dashboard blinked like a tiny city at night. It felt alive.

But I made a mistake once. We used the ODS for a noon sales report. The numbers changed each refresh, because late events kept flowing in. Finance got mad. I get it. They wanted final numbers, not a moving target. We fixed it by pointing that report to the warehouse, with a daily cut-off.

Lesson burned in: the ODS is great for “what’s happening.” It’s not great for “what happened.”

My warehouse story: Snowflake gave us calm, steady facts

For analytics, we used Snowflake for the warehouse. Fivetran pulled from Shopify, Stripe, and our ODS snapshots. dbt built clean models. Power BI sat on top.

We kept five years of orders. We grouped facts and dimensions, star schema style. It wasn’t flashy. But it was solid. If you’re curious how other modeling patterns like data vault or one big table compare, here’s a candid rundown of the different data warehouse models I tried.

Marketing asked for cohort analysis: “How do first-time buyers behave over 6 months?” The warehouse handled it smooth. Historical prices, promo codes, returns—all there. We tracked campaign tags. We joined clean tables. No jitter. The trend lines were stable and made sense.

We also did A/B tests. Version A email vs Version B email. Conversions over time. Cost per order. The warehouse made it simple. No stress about late events moving the goal posts. Truth stayed put.

One time an intern wrote a join without a filter. Boom—huge query. Credits shot up fast. We laughed later, after we put a guardrail on. We added query limits, plus a “slow query” Slack alert through Snowflake’s logs. Small saves add up.

Where the ODS shines

  • Live views for support, ops, and inventory checks
  • Low latency updates (seconds, not hours)
  • Simple, current tables that are easy to read
  • Quick fixes and overrides when the floor is busy

Think about any marketplace where listings come and go constantly—dating and personals boards are prime examples. A visit to the fast-moving Backpage Ormond Beach classifieds shows how fresh posts are added, edited, or removed minute by minute; browsing that feed underscores why an ODS, not a nightly-loaded warehouse, is essential when data loses value the moment it’s stale.

But keep in mind:

  • Data changes a lot; it’s not final
  • Point-in-time history can be weak
  • Reports can jump around as events trickle in

Where the data warehouse shines

  • Stable reporting for finance, sales, and leadership
  • Long-term trends, seasonality, and cohorts
  • Clean models across many sources
  • Data quality checks and versioned logic

But watch for:

  • Higher cost if queries run wild
  • Slower freshness (minutes to hours)
  • More work up front to model things right

So, do you pick one? I rarely do

Most teams need both. The ODS feeds the warehouse. Think of a river and a lake. The river moves fast. The lake stores water, clean and still. You can drink from both—but not for the same reason. If you’d rather not stitch the pieces together yourself, you can look at a managed platform like BaseNow that bundles an ODS and a warehouse under one roof.

Here’s the flow that worked for me:

  • Events land in the ODS from apps and services
  • Snapshots or CDC streams go from the ODS into the warehouse
  • dbt builds the core models (orders, customers, products)
  • Analytics tools (Power BI, Tableau, Looker) read the warehouse

In one healthcare project, we went with BigQuery for the warehouse and Postgres for the ODS. Nurses needed live patient statuses on tablets. Analysts needed weekly outcome reports. Same data family, different time needs. The split worked well.

Real-life hiccups and quick fixes

  • Time zones: We had orders stamp in UTC and users ask in local time. We added a “reporting day” column. No more “Why did my Tuesday shrink?” fights.
  • Late events: A shipment event arrived two days late. We used “grace windows” in the warehouse load, so late stuff still landed in the right day.
  • PII control: Emails and phone numbers got masked in the warehouse views for general users. The ODS kept full detail for service tools with strict access.
  • Quality checks: dbt tests caught null order_ids. We also used Great Expectations for a few key tables. Simple rules saved many mornings.
  • Want the full play-by-play of how I stress-tested warehouse pipelines? I wrote up the testing framework that actually stuck for us.

Costs, people, and pace

The ODS was cheap to run but needed care when traffic spiked. Indexes and query plans mattered. On-call meant I slept light during big promos. A small read-only replica helped a lot.

The warehouse cost more when heavy dashboards ran. But it made reporting smooth. We added usage monitors and nudged analysts toward slimmer queries. Training helped. A 30-minute lunch-and-learn cut our bill that month. Funny how that works.

Cloud bills can still get scary, though. More than once we joked about needing a “data sugar daddy” to sponsor our Snowflake credits. If that phrase sparks your curiosity outside the data realm, you can check out this thorough rundown of SugarDaddyMeet which walks through membership tiers, safety features, and real-life success stories—for anyone genuinely considering that kind of mutually beneficial arrangement.

What about speed?

I aim for:

  • ODS: 5–30 seconds end-to-end for key events
  • Warehouse: 15 minutes for standard refresh, 1–4 hours for giant jobs

Could we go faster? Sometimes. But then costs go up, or pipelines get fragile. I’d rather be steady and sane.

Quick rules I actually use

  • If a human needs the “now” view, use the ODS.
  • If a leader needs a slide with numbers that won’t shift, use the warehouse.
  • If you must mix them, pause. You’re likely tired or rushed. Split the use case, even if it takes an extra day.

A short Q4 memory

We were two weeks from Black Friday. A bug made the ODS drop a few order events. It was small, but it mattered. We added a backfill job that rechecked gaps every 10 minutes. The ops team got their live view back. Later that night, I walked my dog, and the cold air felt so good. The fix held. I slept well.

My final take

The ODS is your heartbeat. The warehouse is your memory. You need both if you care about speed and truth.

If you’re starting fresh:

  • Stand up a simple ODS on Postgres or MySQL
  • Pick a warehouse you know—Snowflake, BigQuery, Red
Published
Categorized as Model

I Tried 6 Data Lake Vendors. Here’s My Honest Take.

Hi, I’m Kayla. I work in data, and I touch this stuff every day. I’ve set up lakes for retail, ads, and IoT. I’ve stayed up late when things broke. I’ve watched costs creep. And yes, I’ve spilled coffee at 2 a.m. while fixing a bad job.

If you want the full test-drive narrative across all six platforms, I’ve published it here: I tried 6 data lake vendors—here’s my honest take.

I used each tool below on real projects. I’ll share what clicked, what hurt, and what I’d do again.


AWS S3 + Lake Formation + Athena: Big, cheap, and a bit noisy

I ran our clickstream lake on S3. Around 50 TB. We used Glue Crawlers, Lake Formation for access, and Athena for SQL. Parquet files. Daily partitions.

  • Real example: We pulled web events from Kinesis, wrote to S3, and let analysts query in Athena. On Black Friday, it held up. I was scared. It was fine.

What I liked

  • Storage is low cost. My bill was close to what I expected.
  • Tools everywhere. So many apps work with S3.
  • Lake Formation let us set table and column rules. Finance got only what they needed.

What bugged me

  • IAM rules got messy fast. One deny in the wrong spot, and nothing worked.
  • Small files slowed us down. We had to compact files nightly.
  • Athena was fast some days, slow others. Caches helped; still, it varied.

Tip: Partition by date and key. Use Parquet or Iceberg. And watch Athena bytes scanned, or you’ll pay more than you think.

For a deep dive into locking down access, the AWS docs on how Athena integrates with Lake Formation’s security model are gold: secure analytics with Lake Formation and Athena.


Azure Data Lake Storage Gen2 + Synapse: Polite and locked in (in a good way)

I used ADLS Gen2 for IoT data from 120k devices. We used Synapse serverless SQL to query Parquet. Access was set with Azure AD groups. It felt… tidy.

  • Real example: We stored sensor data by device and date. Engineers used Synapse to trend errors by region. We used ACLs to keep PII safe.

What I liked

  • Azure AD works clean with storage. Easy for our IT team.
  • Folder ACLs made sense for us. Simple mental model.
  • Synapse serverless ran fine for ad hoc.

What bugged me

  • Listing tons of small files got slow. Batch writes are your friend.
  • ACLs and POSIX bits got confusing at times. I took notes like a hawk.
  • Synapse charges added up on wide scans.

Tip: Use larger Parquet files. Think 128 MB or more. And keep a naming plan for folders from day one.


Google Cloud BigLake + GCS + BigQuery: Smooth… until you leave the garden

I set up a marketing lake on GCS, with BigLake tables in BigQuery. We pointed SQL at Parquet in GCS. It felt simple, and that’s not a small thing.

  • Real example: Ads and email events lived in GCS. Analysts hit it from BigQuery with row filters by team. The queries were snappy.

What I liked

  • IAM felt clean. One place to manage access.
  • BigQuery did smart stuff with partitions and filters.
  • Materialized views saved money on common reports.

What bugged me

  • Egress costs bit us when Spark jobs ran outside GCP.
  • Scans can cost a lot if you don’t prune. One bad WHERE and, oof.
  • Cross-project setup took care. Small, but real.

Tip: Use partitioned and clustered tables. Add date filters to every query. I know, it’s boring. Do it anyway.

Quick side quest: if you’re hunting for a quirky public dataset to practice location filters, scraping, and sentiment parsing, I once pulled a snapshot of Lakeland, FL classifieds from a modern Backpage clone—Backpage Lakeland—the listings are free to browse and deliver messy, semi-structured ad data (titles, prices, geopoints) that’s perfect for stress-testing partitioning strategies and text-cleaning pipelines.


Databricks Lakehouse (Delta): The builder’s toolbox

This one is my favorite for heavy ETL. I used Databricks for streaming, batch jobs, and ML features. Delta Lake fixed my small file pain.

  • Real example: I built a returns model. Data from orders, support tickets, and web logs landed in Delta tables. Auto Loader handled schema drift. Time Travel saved my butt after a bad job.

What I liked

  • Delta handles upserts and file compaction. Life gets easier.
  • DLT pipelines helped us test and track data quality.
  • Notebooks made hand-off simple. New hires learned fast.

What bugged me

  • Job clusters took time to start. I stared at the spinner a lot.
  • DBU costs were touchy. One long cluster burned cash.
  • Vacuum rules need care. You can drop old versions by mistake.

Tip: Use cluster pools. Set table properties for auto-optimize. And tag every job, so you can explain your bill.

For a nuts-and-bolts walkthrough of how I assembled an enterprise-scale lake from scratch, see I built a data lake for big data—here’s my honest take.

Need an even richer checklist? Databricks curates a thorough set of pointers here: Delta Lake best practices.


Snowflake + External Tables: Easy SQL, careful footwork

We used Snowflake with external tables on S3 for audit trails. Finance loved the RBAC model. I loved how fast folks got value. But I did tune a lot.

  • Real example: Logs lived in S3. We created external tables, then secure views. Auditors ran checks without touching raw buckets.

What I liked

  • Simple user model. Roles, grants, done.
  • Performance on curated data was great.
  • Snowpipe worked well for fresh files.

What bugged me

  • External tables needed metadata refreshes.
  • Not as fast as native Snowflake tables.
  • Warehouses left running can burn money. Set auto-suspend.

Tip: Land raw in S3, refine into Parquet with managed partitions, then expose with external tables or copy into native tables for speed.


Dremio + Apache Iceberg: Fast when tuned, quirky on Monday

I ran Dremio on top of Iceberg for ad-hoc work. Reflections (their caches) made some ugly queries fly. But I had to babysit memory.

  • Real example: Product managers ran free-form questions on session data. We set row-level rules. Reflections hid the pain.

What I liked

  • Iceberg tables felt modern. Schema changes were calm.
  • Reflections gave us speed without lots of hand code.
  • The UI made lineage clear enough for non-engineers.

What bugged me

  • Memory tuning mattered more than I hoped.
  • Early drivers gave me a few gray hairs.
  • Migrations needed careful planning.

Tip: Keep Iceberg metadata clean. Compact often. And pick a strong catalog (Glue, Nessie, or Hive metastore) and stick with it.


Costs I actually saw (rough ballpark)

  • S3 storage at 50 TB was near a little over a grand per month. Athena was up and down, based on scanned data.
  • Databricks varied the most. When we cleaned up clusters and used pools, we cut about 30%.
  • BigQuery stayed steady when we used partitions. One bad unfiltered scan doubled a week’s spend once. I still remember that day.
  • Snowflake was calm with auto-suspend set to a few minutes. Without that, it ran hot.

If you’ve ever struggled to visualize how small, usage-based meters balloon into a scary invoice, it helps to study a simpler system that still charges by tiny “units.” The InstantChat team turns the concept into a quick game called Token Keno—after playing through their probability walkthrough and using their calculators, you’ll walk away with an intuitive feel for how millions of micro-charges (tokens, scanned bytes, etc.) add up so you can budget your lake more confidently.

Your numbers will differ. But the pattern holds: prune data, batch small files, and tag spend.


So… which would I choose?

  • Startup or small team: S3 + Athena or BigQuery + GCS. Keep it simple. Ship fast.
  • Heavy pipelines or ML: Databricks with Delta. It pays off in stable jobs.
  • Microsoft shop: ADLS Gen2 + Synapse. Your IT team will thank you.
  • Finance or audit first: Snowflake, maybe with external tables, then move hot data inside.
  • Self-serve speed on Iceberg: Dremio, if you have folks who like tuning.

Honestly, most teams end up mixing. That’s okay. Pick a home base, then add what you need.

And if you’re weighing whether to stick with a lake or branch into data mesh or data fabric patterns, my side-by-side breakdown might help: [I tried data lake,

I Tried a Data Lake Testing Strategy. Here’s My Honest Take.

I’m Kayla, and I’m a data person who cares a lot about tests. Not because I’m a robot. Because I hate bad numbers on a dashboard. They ruin trust fast.

If you want the blow-by-blow version with log outputs and error screenshots, I documented it all in BaseNow’s article “I Tried a Data Lake Testing Strategy. Here’s My Honest Take.”

Last year, I ran a full testing setup for a real data lake. It was for a mid-size retail group in the U.S. We used S3, Databricks with Delta tables, Glue catalog, Airflow, and Power BI. For checks, I used Great Expectations, PySpark unit tests with pytest, and a simple JSON schema contract. It was not fancy. But it worked. Most days.

So, did my strategy help? Yes. Did it catch messy stuff before it hit exec reports? Also yes. Did it break sometimes? Oh, you bet.

Let me explain.


What I Actually Built

  • Zones: raw, clean, and serve (think: landing, logic, and ready-to-use)
  • Tools: Great Expectations for data checks, pytest for Spark code, Airflow for runs, GitHub Actions for CI
  • Formats: JSON and CSV in raw, Delta in clean and serve
  • Contracts: JSON Schema in Git for each source table
  • Alerts: Slack and email with short, plain messages

For teams still weighing which storage engine or managed service to adopt, my comparison of six leading providers in “I Tried 6 Data Lake Vendors—Here’s My Honest Take” might save you some evaluation cycles.

It sounds tidy. It wasn’t always tidy. But the map helped.


The Core Strategy, Step by Step

1) Raw Zone: Guard the Gate

  • Schema check: Does the column list match the contract?
  • Row count check: Did we get anything at all?
  • File check: Is the file type right? Is the gzip real gzip?
  • Partition check: Did the date folder match the file header date?

Real example: Our loyalty feed sent 17 CSV files with the wrong date in the header. My check saw a date mismatch and stopped the load. We asked the vendor to resend. They did. No broken churn chart later. Small win.

2) Clean Zone: Fix and Prove It

  • Null rules: No nulls in keys; set sane defaults
  • Duplicates: Check for dup keys by store_id + date
  • Join checks: After a join, row counts should make sense
  • Business rules: Price >= 0; refund_date can’t be before sale_date

Real example: We hit a null spike in the product table. Fill rate for brand dropped from 87% to 52% in one run. Alert fired. We paused the model. Vendor had a code change. They patched it next day. We backfilled. The chart didn’t flutter.

3) Serve Zone: Trust but Verify

  • Totals: Sales by day should match POS files within 0.5%
  • Dimension drift: If store_count jumps by 20% in a day, flag it
  • Freshness: Facts must be newer than 24 hours on weekdays
  • Dashboard checks: Compare top-10 products to last week’s list

Real example: On a Monday, the weekend sales were light by 12%. Our watermark test saw late data. The recovery job backfilled Sunday night files. Reports self-healed by noon. No angry sales calls. I slept fine.


The Tests I Liked Most

  • Schema version gate: Contracts lived in Git. If a source added a column, we bumped the version. The pipeline refused to run until we added a rule. It felt strict. It saved us.
  • PII guard: We ran a regex scan for emails, phones, and SSN-like strings in clean tables. One day, a supplier sent an “customer_email” field hidden in a notes column. The job failed on purpose. We masked it, reloaded, and moved on.
  • Small files alarm: If a partition had more than 500 files under 5 MB, we warned. We then auto-merged. This cut read time on Athena from 2.3 minutes to 28 seconds for a heavy SKU report.

What Broke (and how I patched it)

  • Great Expectations on huge tables: It crawled on wide, hot data. Fix: sample 5% on row-heavy checks, 100% on key checks. Fast enough, still useful.
  • Dates from time zones: Our Sydney store wrote “yesterday” as “today” in UTC. Schedules slipped. Fix: use event_time, not load_time, for freshness checks.
  • Late CDC events: Debezium sent update messages hours later. Our SCD2 tests thought we missed rows. Fix: widen the watermark window and add a daily backfill at 2 a.m.
  • Flaky joins in tests: Dev data did not match prod keys. Fix: seed small, stable test data in a separate Delta path. Tests ran the same each time.

Academic readers might appreciate that many of these checks echo findings in the recent systems paper on scalable data-quality validation presented in this arXiv preprint, which benchmarks similar techniques against petabyte-scale workloads.


A Few Real Numbers

  • We blocked 14 bad loads in 6 months. Most were schema changes and null spikes.
  • Alert noise dropped from 23 per week to 5 after we tuned thresholds and grouped messages.
  • A broken discount rule would’ve cost us a 3% error on gross margin for two weeks. A simple “price >= cost when promo=false” test caught it.

The Part That Felt Like Magic (and wasn’t)

We added “data contracts” per source. Just a JSON file with:

  • Column name, type, and nullable
  • Allowed values for enums
  • Sample rate for checks
  • Contact on-call person

When a source wanted a change, they opened a PR. The tests ran in CI on sample files. If all passed, we merged. No more surprise columns. It was boring. Boring is good.

By the way, if you’re looking for a structured, field-tested approach to defining and enforcing these agreements, the O’Reilly book “Data Contracts: Managing Data Quality at Scale” lays out patterns that map neatly to the playbook above.


Things I’d Do Differently Next Time

  • Write fewer, sharper rules. Key fields first. Facts next. Fancy later.
  • Put check names in plain English. “Nulls in customer_id” beats “GE-Rule-004.”
  • Add cost checks early. Big queries that hit wide tables should get a warning.
  • Store one-page run books for each test. When it fails, show how to fix it.

Quick Starter Kit (what worked for me)

  • Pick 10 checks only:
    • Schema match
    • Row count > 0
    • Freshness by event_time
    • No nulls in keys
    • Duplicates = 0 for keys
    • Price >= 0
    • Date logic valid
    • Totals within 0.5% vs source
    • PII scan off in raw, on in clean
    • Small file alarm
  • Automate with Great Expectations and pytest
  • Run smoke tests on every PR with GitHub Actions
  • Alert to Slack with short, clear text and a link to rerun

And if you’re dealing with petabyte-scale streams and wondering how the foundations scale, my build log in “I Built a Data Lake for Big Data—Here’s My Honest Take” breaks down the design decisions.

For teams that prefer a ready-made solution instead of stitching tools together, a managed platform like BaseNow bundles contracts, tests, and alerting so you can be production-ready in hours.


A Small Holiday Story

Black Friday hit. Feeds were wild. We saw 3 late drops, 2 schema nudges, and one scary file that said “NULL” as text. The checks held. We backfilled twice. Reports stayed steady. Folks in stores kept selling. I ate leftover pie and watched the jobs. Felt good.


Who Should Use This

  • Data teams with 2 to 10 engineers
  • Shops on S3, ADLS, or GCS, with Spark or SQL
  • Anyone who ships daily reports that can’t be wrong

If you’re still deciding between lake, mesh, or fabric patterns, you might like my field notes in “I Tried Data Lake, Data Mesh, and Data Fabric—Here’s My Real Take.”

If you run real-time microseconds stuff, you’ll need more. But for daily and hourly loads, this works.


Verdict

Before we wrap, consider industries that live and die on hyper-personalized user interactions. Think adult dating marketplaces: if location or preference data drifts, matches feel random and users churn fast. The engineers behind LocalSex share how rigorous real-time validation keeps their geo-matching accurate and their community

Data Hub vs Data Lake: My Hands-On Take

I’ve built both. I got burned by both. And yes, I still use both. Here’s what actually happened when I put a data lake and a data hub to work on real teams. For an expanded breakdown of the differences, check out my standalone explainer on Data Hub vs Data Lake: My Hands-On Take.

First, quick picture talk

  • Data lake: a big, cheap store for raw data. Think S3 or Azure Data Lake. Files go in fast. You read and shape them later.
  • Data hub: a clean station where trusted data gets shared. It sets rules, checks names, and sends data to many apps. Think Kafka plus MDM, or Snowflake with strong models and APIs.

If you’d like an additional industry-focused perspective, TechTarget’s overview does a solid job of contrasting data hubs and data lakes at a high level.

Simple? Kind of. But the feel is different when you live with them day to day.

My retail story: the lake that fed our models

At a mid-size retail shop, we built an AWS data lake. We used S3 for storage. AWS Glue crawled the files. Athena ran fast SQL. Databricks ran our Spark jobs. We also added Delta Lake so we could update data safely.

What went in?

  • Click logs from our site (CloudFront logs and app events)
  • Store sales files (CSV from shops each night)
  • Product data from MySQL (moved with AWS DMS)

What did it do well?

  • Our ML team trained models in hours, not days. Big win.
  • We ran ad-hoc checks on two years of logs. No heavy load on our core DB.
  • Costs stayed low when data sat still.

Where it hurt?

  • File names got messy. We had “final_final_v3.csv” everywhere. Not proud.
  • Lots of tiny files. Athena slowed down. So we had to compact them.
  • People misread columns. One analyst used UTC. One used local time. Oof.

Fixes that helped:

  • Delta Lake tables with simple folder rules
  • Partitions by date, not by every little thing
  • A short “what this table is” note in a shared sheet (later we used a catalog)

You know what? The lake felt like a big garage. Great space. But it gets cluttered unless you clean as you go. I chronicled the gritty details of that build in an in-depth post, I Built a Data Lake for Big Data—Here’s My Honest Take.

My health data story: the hub that kept us honest

At a hospital network, we needed one truth for patients and doctors. Many apps. Many forms. Lots of risk. We built a hub.

Core pieces:

  • Kafka for real-time events
  • Debezium for change data capture from source DBs
  • Informatica MDM for “golden” records (IDs, names, merges)
  • An API layer to share clean data with apps
  • Collibra for terms and who owns what

What it did well:

  • New apps could plug in fast and get the same patient ID. No more “John A vs John Allen” chaos.
  • Access rules were tight. We could mask fields by role.
  • Audits were calm. We could show who changed what and when.

Where it hurt:

  • Adding a new field took time. Reviews, tests, docs. Slower, but safer.
  • Real-time streams need care. One bad event schema can break a lot.
  • Merges are hard. People change names. Addresses change. We had edge cases.

Still, the hub felt like a clean train station. Schedules. Signs. Safe lines. Less wild, more trust.

That experience has weird parallels outside analytics circles too. If you’ve ever tried to manage a local classifieds board without it devolving into spam and duplicate posts, you’ll recognise how disciplined governance keeps things usable. A quick look at the structured layout of the Citrus Heights Backpage listings illustrates how consistent categories, required fields, and active moderation preserve searchability and trust—takeaways you can directly apply when designing data quality rules for your own hub.

A lean startup twist: both, but light

At a startup, we did a simple version of both:

  • Fivetran pulled data into Snowflake.
  • dbt made clean, shared tables (our mini hub).
  • Raw files also lived in S3 as a small lake.
  • Mode and Hex sat on top for charts and quick tests.

This mix worked. When a marketer asked, “Can I see trial users by week?” we had a clean table in Snowflake. When the data science lead asked, “Can I scan raw events?” the S3 bucket had it.

So which one should you use?

Here’s the thing: the choice depends on your need that day.

Use a data lake when:

  • You have lots of raw stuff (logs, images, wide tables).
  • You want low-cost storage.
  • You explore new ideas, or train models.
  • You don’t know all questions yet.

Use a data hub when:

  • Many apps need the same clean data.
  • You need rules, names, and IDs set in one place.
  • You have privacy needs and fine access control.
  • You want a “single source of truth.”

Sometimes you start with a lake. Then, as teams grow, you add a hub on top of trusted parts. That’s common. I’ve done that more than once. For a deeper dive into setting up lightweight governance without slowing teams down, I found the practical guides on BaseNow refreshingly clear.

Real trade-offs I felt in my bones

  • Speed to add new data:

    • Lake: fast to land, slower to trust.
    • Hub: slower to add, faster to share with confidence.
  • Cost:

    • Lake: storage is cheap; compute costs can spike on messy queries.
    • Hub: tools and people cost more; waste goes down.
  • Risk:

    • Lake: easy to turn into a swamp if you skip rules.
    • Hub: can become a bottleneck if the team blocks every change.
  • Users:

    • Lake: great for data scientists and power analysts.
    • Hub: great for app teams, BI, and cross-team work.

My simple rules that keep me sane

  • Name things plain and short. Date first. No cute folder names.
  • Write a one-line purpose for every main table.
  • Add a freshness check. Even a tiny one.
  • Pick 10 core fields and make them perfect. Don’t chase 200 fields.
  • Set owners. One tech owner. One business owner. Real names.
  • For streams, use a schema registry. Do not skip this.

A quick, honest note on “lakehouse”

Yes, I’ve used Databricks with Delta tables like a “lakehouse.” It blends both worlds a bit. It helped us keep data cleaner in the lake. But it didn’t replace the hub need when many apps wanted strict, shared IDs and contracts. For a broader context, IBM’s comparison of data warehouses, lakes, and lakehouses is a handy reference.

If you’re weighing even newer patterns like data mesh or data fabric, I shared my field notes in I Tried Data Lake, Data Mesh, and Data Fabric—Here’s My Real Take.

My bottom line

  • The lake helps you learn fast and train well.
  • The hub helps you share clean data with less fear.
  • Together, they sing.

If I were starting tomorrow?

  • Week 1: land raw data in S3 or ADLS. Keep it neat.
  • Month 1: model key tables in Snowflake or Databricks. Add tests in dbt.
  • Month 2: set a small hub flow for your “golden” stuff (customers, products). Add simple APIs or Kafka topics.
  • Ongoing: write short notes, fix names, and keep owners real.

It’s not magic. It’s chores. But the work pays off. And when someone asks, “Can I trust this number?” you can say, calmly, “Yes.” Anyone promising a one-click “just bang” fix for data quality is selling wishful thinking—though, if you’re curious what a literal one-click gratification pitch looks like, take a peek at JustBang where you’ll see how bold promises are packaged for instant consumption.